Taxon Abundance Barplot
GitHub repository: speeding-up-science-workshops/Abundance_barplot/
![]()
Summary
- You can explore differences amongst taxa in metabarcoding data in several different ways. This file will help you determine differences amongst categories in the most abundant taxa in your dataset. Outputs include:
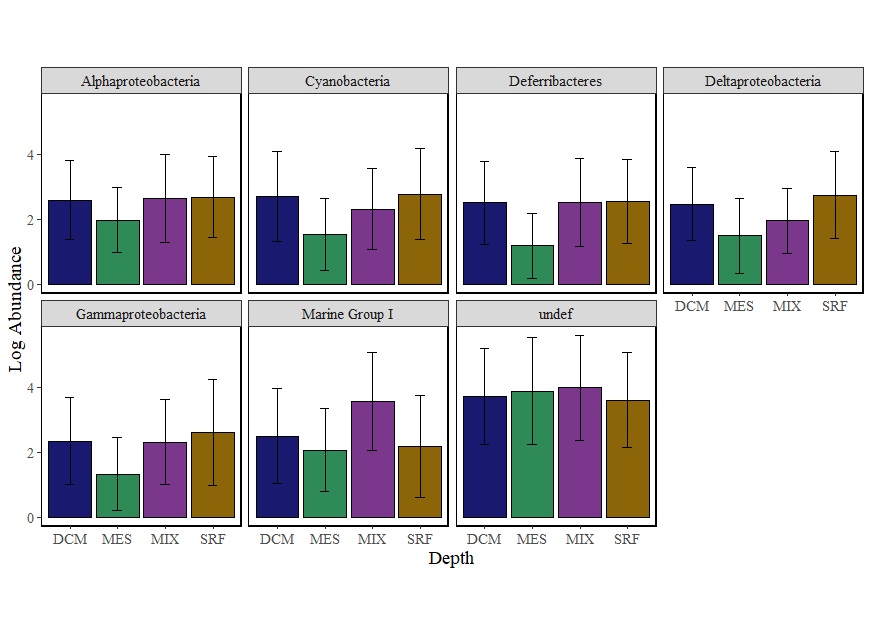
- A group of barplots of the log abundance of the top 20 taxa in the chosen taxonomic category
- An ANOVA with post-hoc Tukey test
Inputs: 1. otu table 2. taxa table 3. mapping file
OR 1. phyloseq file
Authors
- Alia Al-Haj
- Github repo: https://github.com/aliaalhaj
- ORCID: https://orcid.org/0000-0003-1899-5117